November 14th, 2011 | No Comments
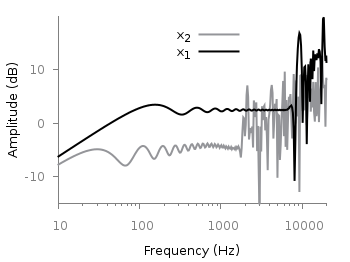
Sometimes it can be useful to be able to invert the entries of the legend. For example in Fig. 1 we have a plot of two frequency responses with the black one plotted as second one in order to stay in front of the gray one.

Fig. 1 Plot of two frequency responses (code to produce this figure, data)
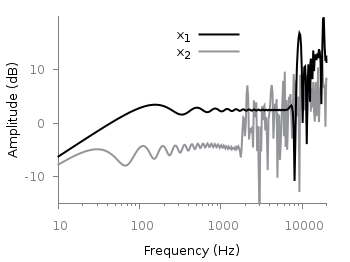
In order to make the order of the entries in the legend more intuitive we can simple tell Gnuplot to invert them. The result is shown in Fig. 2.
set key invert

Fig. 2 Plot of two frequency responses (code to produce this figure, data)