November 30th, 2010 | No Comments
For some plots it is nice to have exactly the same size for the given unit on both axes. In Fig.1 you could see the amplitude of a point source in a given space.
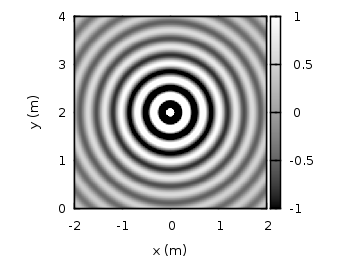
Fig. 1 Image plot of a wave field given by the data file data (code to produce this figure)
The wave field of the point source is given by Green’s function:
 = \frac{1}{4\pi |\mathbf{x}-\mathbf{x}_\text{s}|} \; e^{i \frac{\omega}{c} |\mathbf{x}-\mathbf{x}_\text{s}|}")
To apply the same sizes at both axes the set ratio command is the one to look after. A value of -1 will ensure that we will get the same sizes.
set ratio -1