January 8th, 2015 | 9 Comments
Some time ago I discussed how to get the jet colormap from Matlab in gnuplot. Since Matlab R2014b jet is no longer the default colormap. Now parula is the new default colormap. It was introduced together with new default line colors.
The changes in the default colormap address some of the points that were criticized of jet by Moreland and corrected by his colormap.

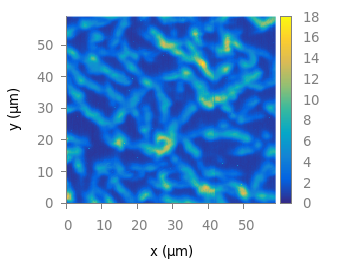
Fig. 1 Photoluminescence yield plotted with the parula colormap from Matlab (code to produce this figure, parula.pal, data)
A colormap similar to the original is stored in the parula.pal file, which is also part of the gnuplot-palettes repository on github. An example application of the colormap is presented in Fig. 1.
In order to apply the colormap you can simply load the file.
load 'parula.pal'
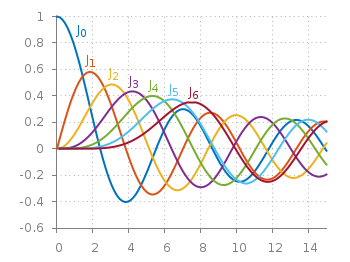
The parula.pal file also includes definitions of line styles. The first line styles (1-9) corresponds to the colors of the parula palette, the line styles 11-17 correspond to the new Matlab line colors, see Fig. 2.

Fig. 2 Bessel functions from order zero up to six plotted with the new default Matlab line colors. (code to produce this figure, parula.pal, data)
set style line 11 lt 1 lc rgb '#0072bd' # blue
set style line 12 lt 1 lc rgb '#d95319' # orange
set style line 13 lt 1 lc rgb '#edb120' # yellow
set style line 14 lt 1 lc rgb '#7e2f8e' # purple
set style line 15 lt 1 lc rgb '#77ac30' # green
set style line 16 lt 1 lc rgb '#4dbeee' # light-blue
set style line 17 lt 1 lc rgb '#a2142f' # red
If you want to use only the palette and not the line colors, you should remove them from the parula.pal file.
Hi. nice post. I used your colour palette in Python, looks great. But,
is this palette copyrighted? I cannot find info about that
Cheers
Good question, Matlab claims that the palette is indeed protected. This let to a discussion at matplotlib if you could protect a colormap, which is similar to solving an optimization problem.
However, I changed the parula.pal file which is now only an approximation of the original colormap.
That’s clever :) I cannot believe someone can claim copyright about a bunch of numbers haha
By specifying the line style in the “*.pal” files using “set style line”, the “linestyle” option has to be used in every single plot command. For example “plot sin(x)” will still use the default styles, while “plot sin(x) ls 1” will use linestyle number 1.
Using “set linetype” in the “*.pal” files redefines the basic line types. Thus the “linestyle” option is not necessary. At least for me, this approach is more convenient.
Hi Heini.
I use
set linetypein most cases to change the dashtype of a given line as it is the only way in gnuplot 4.6 to achieve it, andlinestyleto choose the color. In gnuplot 5.0set dashtypewas finally added so that in the future I will probably consider to change the settings in the *.pal files to linetype.Hi,
Pretty useful posts, as usual! I have a rather stupid question I think. I have 17 sets of data, I was wondering after you load the parula.pal; do you again need to define those line styles? Why do you start from ls 11, 12…. Can one just start from ls 1,2…… Sorry if the question sounds stupid. I am plotting the data with points and then comparing them with my model…. I am planning to use your suggestions here. By any chance do you have a specific colormap in mind which would be good with both colors and at least distinguishable in black and white print?
Thanks & Regards
Hello, and thank you for a great website,
I tried to load the parula.pal, it doesn’t work for me (gnuplot v 5.0). I tried a couple of other repositories, they worked fine. I cannot find the error in the file. Could you please help me?
Kind regards
Hi Benoit.
If I execute the code and data from Fig. 1 with gnuplot 5.0 I get exactly the same result as in Fig. 1. Could you please explain in more detail what “doesn’t work for me” means.
Not sure exactly why, but it works a charm now. Thanks for offering your help.