September 8th, 2011 | 3 Comments
In the last entry about attractive plots we introduced the usage of gray borders and tics in order to emphasize the content of the figure.
If we want to do the same in the epslatex terminal, we had to add the color of the text directly with some LaTeX code:
set terminal epslatex size 10.4cm,6.35cm color colortext standalone \
'phv,9' header '\definecolor{tics}{rgb}{0.5,0.5,0.5}'
set format '\color{tics}$%g$'
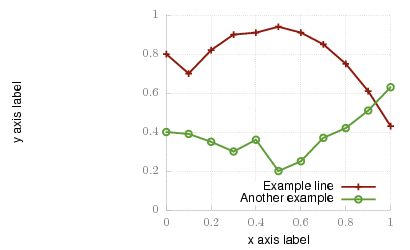
The problem is that the output looks not the way it should be, but like the one in Fig. 1.
It appears that all the letters we have written in the format string are used for the calculation of the size of the tics.

Fig. 1 Colored tics plotted with Gnuplot version <4.4.3 (code to produce this figure)
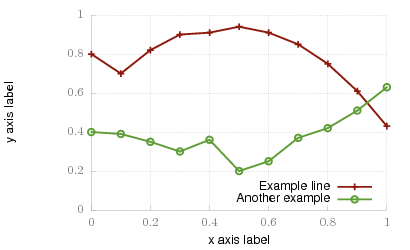
An easy solution to that problem is to use Gnuplot 4.4.3, because the size calculation has been updated. Fig. 2 shows the result if we use Gnuplot 4.4.3 to create the figure. But still there is some room for improvements.

Fig. 2 Colored tics plotted with Gnuplot 4.4.3 (code to produce this figure)
The length of the color name has still an influence on the calculated tics size. Hence we use only one letter for the color definition:
set terminal epslatex size 10.4cm,6.35cm color colortext standalone \
'phv,9' header '\definecolor{t}{rgb}{0.5,0.5,0.5}'
set format '\color{t}$%g$'
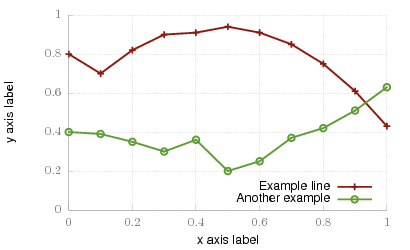
The final result is shown in Fig. 3.

Fig. 3 Colored tics plotted with Gnuplot 4.4.3 (code to produce this figure)
Or you could just use “set lmargin” to assign the correct size yourself.
Yes, you could correct the plot yourself, but it is a little bit tricky to find the right values. You have not only to set the lmargin correct, but also the offset for the ylabel.
To fix the plot in Fig. 1 you have to apply the following values:
set ylabel ‘y axis label’ offset 14,0
set lmargin 8
This is a wonderful passage, my plot looks much better after adapted those scripts. Thank you!