March 15th, 2012 | 8 Comments
Suppose you have an image and wanted to add some lines, arrows, a scale or whatever to it. Of course you can do this easily with Gnuplot as you can see in Fig. 1.
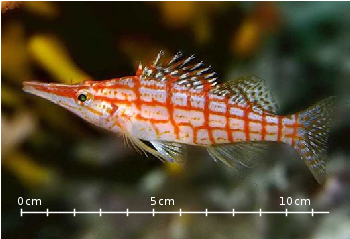
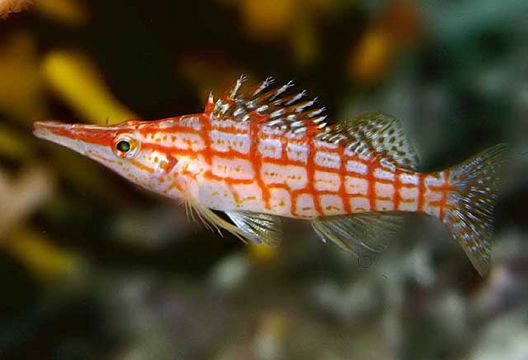
Fig. 1 Plotting a jpg image within your graph and adding a scale (code to produce this figure, image data). Image source: © SFTEP.
To plot the jpg image of the longnose hawkfish you have to tell the plot command that you have binary data, the filetype, and choose rgbimage as a plotting style. Also we ensure that the image axes are in the right relation to each other by setting ratio to -1.
set size ratio -1
plot 'fish.jpg' binary filetype=jpg with rgbimage
The scale needs a little more work, because Gnuplot can not plot a axis with tics to both directions of it. Hence we are using a bunch of arrows to achieve the same result. The text is than set by labels to the axis.
set arrow from 31,40 to 495,40 nohead front ls 1
set for [ii=0:11] arrow from 31+ii*40,35 to 31+ii*40,45 nohead \
   front ls 1
# set number and unit as different labels in order
# to get a smaller distance between them
set label '0'  at  25,57 front tc ls 1
set label 'cm' at  37,57 front tc ls 1
set label '5'  at 225,57 front tc ls 1
set label 'cm' at 237,57 front tc ls 1
set label '10' at 420,57 front tc ls 1
set label 'cm' at 442,57 front tc ls 1