March 12th, 2013 | 12 Comments
We discussed already the plotting of heat maps at more than one occasions. Here we will add the possibility to interpolate the data in a heat map figure.

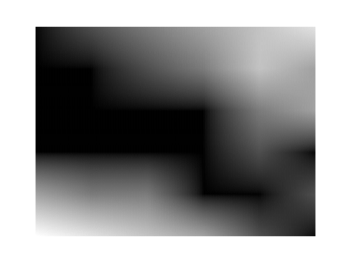
Fig. 1 A simple heat map (code to produce this figure, data)
Suppose we have the following data matrix, stored in heat_map_data.txt.
6 5 4 3 1 0
3 2 2 0 0 1
0 0 0 0 1 0
0 0 0 0 2 3
0 0 1 2 4 3
0 1 2 3 4 5
The normal way of plotting them would be with
plot 'heat_map_data.txt' matrix with image
But to be able to interpolate the data we have to use splot and pm3d instead.
set pm3d map
splot 'heat_map_data.txt' matrix
In Fig. 1 the result of plotting the data just with splot, without interpolation is shown. Note, that the result differs already from the plot command. The plot command would have created six points, whereas the splot command comes up with only five different regions for every axis.

Fig. 2 A heat map interpolated to use twice as much points on every axis (code to produce this figure, data)
Now if we want to double the number of visible points, we can tell pm3d easily to interpolate the data by the interpolate command.
set pm3d interpolate 2,2
The two numbers 2,2 are the number of additional points along the x- and y-axis.
The resulting plot can be found in Fig. 2.

Fig. 3 A heat map interpolated with an optimal number of points (code to produce this figure, data)
In addition to explicitly setting the number of points we can tell gnuplot to choose the correct number of interpolation points by itself, by setting them to 0.
set pm3d interpolate 0,0
Now gnuplot decides by itself how to interpolate, which leads to the result in Fig. 3.