August 22nd, 2013 | 30 Comments
On the PGF plots page I found a nice example of visualizing data with cubes. Here we will recreate the same with gnuplot as you can see in Fig. 1.
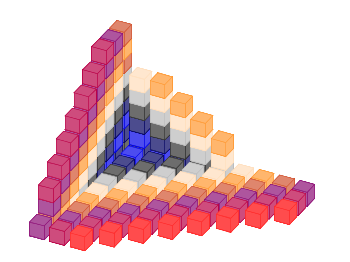
Fig. 1 Cubes with different colors. (code to produce this figure, cube function, data)
We need basically two things in order to achieve it. First we have to plot a single cube with gnuplot. This is not as straight forward as you may think. We have to define a data file for it and plot it with the pm3d style which will result in Fig. 2.
# single cube
0 0 0
0 0 1
0 1 1
0 1 0
0 0 0

1 0 0
1 0 1
1 1 1
1 1 0
1 0 0

0 0 0
1 0 0
1 1 0
0 1 0
0 0 0

0 0 1
1 0 1
1 1 1
0 1 1
0 0 1
set cbrange [0.9:1]
set palette defined (1 '#ce4c7d')
set style line 1 lc rgb '#b90046' lt 1 lw 0.5
set pm3d depthorder hidden3d
set pm3d implicit
unset hidden3d
splot 'cube.txt' u 1:2:3:(1) w l ls 1
The use of the fourth (1) column for the splot command ensures that the cube gets the same color on every side. Only the edges are highlighted by a slighty different color given by the line style.
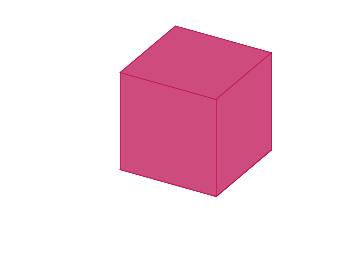
Fig. 2 A single cube. (code to produce this figure, data)
In a second step we reuse the code from the Object placement using a data file entry in order to plot cubes at different positions with different colors. To get the different colors and positions we replace the cube.txt file with a cube function that returns the values for the desired position and color.
add_cube(x,y,z,c) = sprintf('cube(%f,%f,%f,%i) w l ls %i,',x,y,z,c,c)
CMD = ''
stats 'cube_positions.txt' u 1:(CMD = CMD.add_cube($1,$2,$3,$4)) nooutput
CMD = 'splot '.CMD.'1/0 w l ls 2'
eval(CMD)

