Gnuplotting

Create scientific plots using gnuplot

March 2nd, 2015 | 4 Comments

If you are a regular gnuplot user you most probably want to reuse some common settings. I normally avoid it on this blog to have easy scripts that run as standalone files, but during my work I use a lot of small config files.
Bessel functions

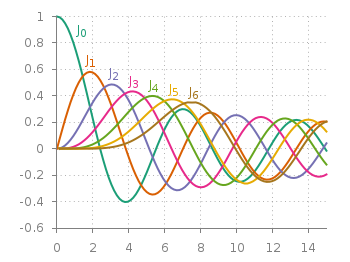
Fig. 1 Bessel functions from order zero up to six plotted with the dark2 line colors. (code to produce this figure, dark2.pal, xyborder.cfg, grid.cfg, mathematics.cfg)

Let us start with the Bessel function example from the last blog entry. As you can see in Fig. 1, it is a 2D plot, including axes, a grid, line colors, and definitions of higher order Bessel functions. All of those could be easily stored in small config files and reused in other plots.
As an example I will start with the axes. Here, I have four different config files, called xyborder.cfg, xborder, yborder.cfg, noborder.cfg, which do exactly what their names would suggest. Here are the first and last file:

# xyborder.cfg
set style line 101 lc rgb '#808080' lt 1 lw 1
set border 3 front ls 101
set tics nomirror out scale 0.75
set format '%g'
# noborder.cfg
set border 0
set style line 101 lc rgb '#808080' lt 1 lw 1
unset xlabel
unset ylabel
set format x ''
set format y ''
set tics scale 0

In the main plotting file I then just have to load the setting I like to have and I’m done. The same can be done for adding a grid, the right line color definitions and the extra Bessel functions leading to the following excerpt from the main plotting file:

# set path of config snippets
set loadpath './config'
# load config snippets
load 'dark2.pal'
load 'xyborder.cfg'
load 'grid.cfg'
load 'mathematics.cfg'

The set loadpath command tells gnuplot the directory where it can find all the configuration snippets. If you want to see an overview, look at my gnuplot configuration snippets and at the collection of palettes and line colors.

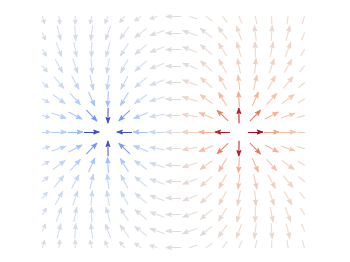
If you want to include more complicated settings, you have to use the macro setting of gnuplot. Fig. 2 is a reproduction of an earlier entry plotting a vector field with arrows. It included an lenghty definition of how to plot these arrows. If you want to do it several time and define the arrows in the same way every time you should also put it into a config file, this time as a variable (macro). In our example it looks like

color_arrows = 'u ($1-dx($1,$2)/2.0):($2-dy($1,$2)/2.0):(dx($1,$2)):(dy($1,$2)):\
(v($1,$2)) with vectors head size 0.08,20,60 filled lc palette'

In the main file the only thing we have then to do is

set macros
load 'noborder.cfg'
load 'moreland.pal'
load 'arrows.cfg'

# [...] 

plot '++' @color_arrows

Important is the first line that enables the use of macros in gnuplot which is disabled by default.
May 21st, 2013 | 1 Comment

As you may have noted, gnuplot and Matlab have different default color maps. Designing such a default map is not easy, because they should handle a lot of different things (Moreland, 2009):
– The map yields images that are aesthetically pleasing
– The map has a maximal perceptual resolution
– Interference with the shading of 3D surfaces is minimal
– The map is not sensitive to vision deficiencies
– The order of the colors should be intuitively the same for all people
– The perceptual interpolation matches the underlying scalars of the map

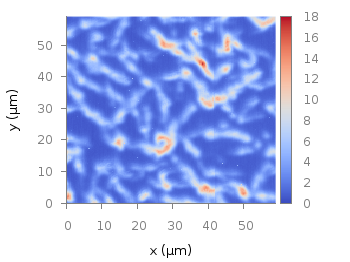
In his paper Moreland developed a new default color map that was mentioned already in a user comment. In Fig. 1 the map is used to replot the photoluminescence yield plotted in an earlier entry.

Default color map after Moreland, 2009

Fig. 1 Photoluminescence yield plotted with the default color map after Moreland, 2009 (code to produce this figure, data)

To use the default color map proposed by Moreland, just download default.plt and store it to a path, that is available to gnuplot. For example store it under /home/username/.gnuplotting/default.plt and add the following line to your .gnuplot file.

set loadpath "/home/username/.gnuplotting"

After that you can just load the palette before your plot command via

load 'default.plt'
Default gnuplot color palette

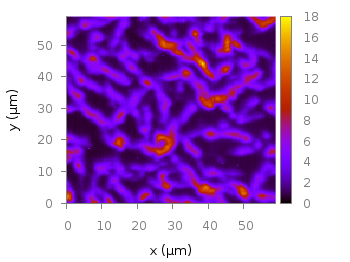
Fig. 2 Photoluminescence yield plotted with gnuplots default color palette (code to produce this figure, data)

In Fig. 2 the same plot is shown using the default color map from gnuplot, which is a little bit dark in my opinion.

Default Matlab color palette

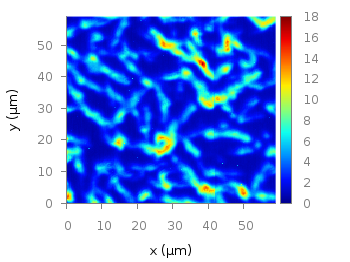
Fig. 3 Photoluminescence yield plotted with Matlabs default color palette (code to produce this figure, data)

Figure 3 shows the jet color map from Matlab, which is a classical rainbow map with all its pros and cons.

April 19th, 2011 | 3 Comments

Often we use a specific line color or output terminal in Gnuplot. Or we are not satisfied with one of the default settings, for example the font used by the png terminal. There exists an easy way to fix these settings. Gnuplot reads a startup file, called .gnuplot under Linux and GNUPLOT.INI under Windows. First it searches the current directory and then your home directory after that file.

Here is an example of what is possible to include in the startup file.

# enable macros
set macros
# search for functions or data files in these directories
set loadpath '/usr/local/lib/gnuplot'
# add default line colors
set style line 1 lc rgb '#0060ad' lt 1 lw 2 pt 5   # blue
set style line 2 lc rgb '#dd181f' lt 1 lw 2 pt 7   # red
# add macros to select the desired line style
BLUE = "1"
RED = "2"
# add macros to select a desired terminal
WXT = "set terminal wxt size 350,262 enhanced font 'Verdana,10' \
   persist"
PNG = "set terminal pngcairo size 350,262 enhanced font 'Verdana,10'"
SVG = "set terminal svg size 350,262 fname \
   'Verdana, Helvetica, Arial, sans-serif' fsize = 10"

With these settings and the use of macros our plotting will become more easier. For example to plot the sinusoid from the plotting functions introduction we can now use the following code.

@WXT
[...]
plot f(x) title 'sin(x)' with lines ls @BLUE, \
     g(x) notitle with lines ls @RED

Note that you have to omit the usage of reset in your code, because it will clear the line style settings.

Sinusoid

Fig. 1 Plotting using the configuration file (code to produce this figure)

You can of course override the style settings of the configuration file.

plot f(x) title 'sin(x)' with lines ls @BLUE, \
     g(x) notitle with lines ls @RED lw 1
Sinusoid

Fig. 1 Overwriting settings from the configuration file (code to produce this figure)