December 1st, 2012 | 7 Comments
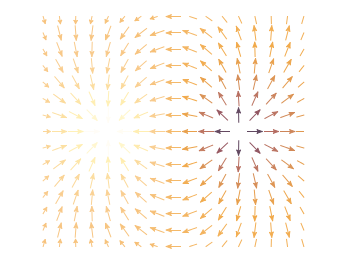
In an earlier entry we created a vector field from measured data. Now we will visualize functions with the vector plotting style. As functions we have two 1/r potentials which define the amplitude of the vectors, as can be seen in Fig. 1. It is often better to indicate the amplitude by a color instead of by the length of the single vectors, especially if there are big changes. For the exact functions have a look into the corresponding file.

Fig. 1 Vector field of two sources with the opposite charge. The color indicates the amplitude. (code to produce this figure)
By analogy to the data vector field we have again a dx, and dy function for the length of the vectors.
dx(x,y) = scaling*ex(x,y)/enorm(x,y)
dy(x,y) = scaling*ey(x,y)/enorm(x,y)
Now we need a trick, because we have to fill the u 1:2:3:4 for the vector style with our function data. The four columns are then x,y,dx,dy of the vectors, where dx, dy are the lengths of the vector in x and y direction. Here the special filename ++ is a big help. It gives us x and y points as a first and second column, which we could address by $1 and $2. The number of points for the two axes are handled by the samples and isosamples command.
set samples 17    # x-axis
set isosamples 15 # y-axis
plot '++' u ($1-dx($1,$2)/2.0):($2-dy($1,$2)/2.0):\
    (dx($1,$2)):(dy($1,$2)):(v($1,$2)) \
    with vectors head size 0.08,20,60 filled lc palette
To place the vector at the center of the single x, y points, we move the starting point of the vectors to x-dx/2, y-dy/2.