Gnuplotting

Create scientific plots using gnuplot

September 29th, 2014 | 6 Comments

Some time ago I introduced already a waterfall plot, which I named a pseudo-3D-plot. In the meantime, I have been asked several times for a colored version of such a plot. In this post we will revisit the waterfall plot and add some color to it.
Colored waterfall plot

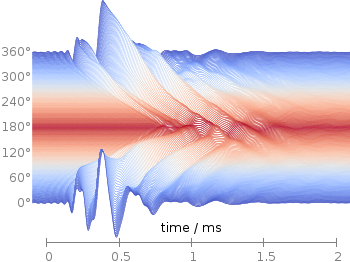
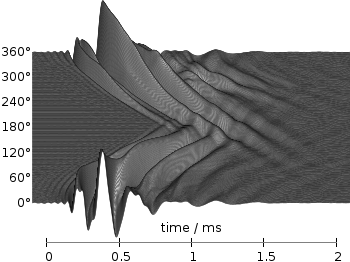
Fig. 1 Waterfall plot of head related impulse responses. (code to produce this figure, color palette, data)

In Fig. 1 the same head related impulse responses we animated already are displayed in a slightly different way. They describe the transmission of sound from a source to a receiver placed in the ear canal dependent on the position of the source. Here, we show the responses for all incident angles of the sound at once. At 0° the source was placed at the same side of the head as the receiver.

The color is added by applying the Moreland color palette, which we discussed earlier. The palette is defined in an extra file and loaded, this enables easy reuse of defined palettes. In the plotting command the palette is enabled with the lc palette command, that tells gnuplot to use the palette as line color depending on the value of the third column, which is given by color(angle).

load 'moreland.pal'
set style fill solid 0.0 border
limit360(x) = x180?360-x:x
amplitude_scaling = 200
plot for [angle=360:0:-2] 'head_related_impulse_responses.txt' \
    u 1:(amplitude_scaling*column(limit360(angle)+1)+angle):(color(angle)) \
    w filledcu y1=-360 lc palette lw 0.5

To achieve the waterfall plot, we start with the largest angle of 360° and loop through all angles until we reach 0°. The column command gives us the corresponding column the data is stored in the data file, amplitude_scaling modifies the amplitude of the single responses, and +angle shifts the data of the single responses along the y-axis to achieve the waterfall.

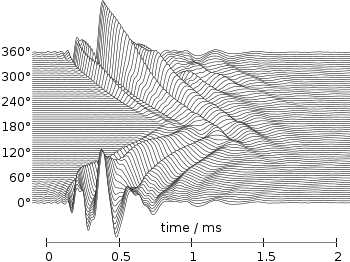
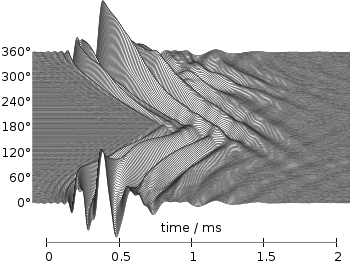
Even though the changing color in the waterfall plot looks nice you should always think if it really adds some additional information to the plot. If not, a single color should be used. In the following the same plot is repeated, but only with black lines and different angle resolutions which also have a big influence on the final appearance of the plot.
Colored waterfall plot

Fig. 2 Waterfall plot of head related impulse responses with a resolution of 5°. (code to produce this figure, data)
Colored waterfall plot

Fig. 3 Waterfall plot of head related impulse responses with a resolution of 2°. (code to produce this figure, data)
Colored waterfall plot

Fig. 4 Waterfall plot of head related impulse responses with a resolution of 1°. (code to produce this figure, data)
June 21st, 2013 | 7 Comments

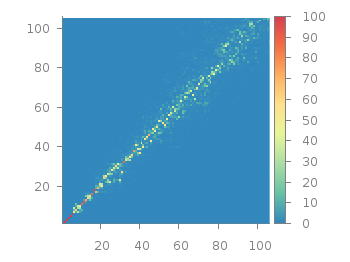
Sometimes a classical heat map will not be the best way to visualize your data in a two dimensional plane. This is especially the case, when only a few data points on the plane have different values. For example in Fig. 1 you find a projection from one vector to another to visualize its similarity. This is a method used in normal mode analysis of molecules to determine if two different
calculations yield similar results. As you can see only the data points near the diagonal vary, which is hard to see because of the small size of the points. In addition, points farer away from the diagonal having a small percentage value are more or less invisible – compare to Fig. 2.

Sparse data with image plot style

Fig. 1 Vector dot product expressed in percentage plotted with the image style (code to produce this figure, data)
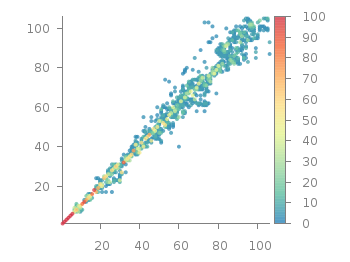
In order to emphasize the data, we abounded the image plot style and use transparent circles as plotting style for visualizing the data as shown in Fig. 2.

Sparse data with circles plot style

Fig. 2 Vector dot product expressed in percentage plotted with the circles style (code to produce this figure, data)

In order to do so, we remove all values from the plot that are 0, by setting them to 1/0. Further we set the transparency of the circles to 20%. Before plotting the data we are sorting them regarding their percentage value in order to plot the highest values above the lower ones.

f(x) = x>2 ? x : 1/0
set style fill transparent solid 0.8 noborder
plot '<sort -g -k3 vector_projection.txt' u 1:2:(1):(f($3)) w circles lc palette

February 6th, 2013 | 8 Comments

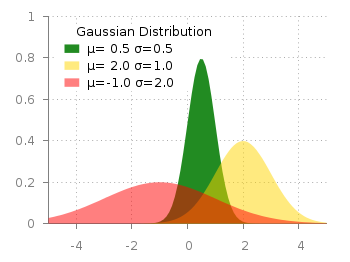
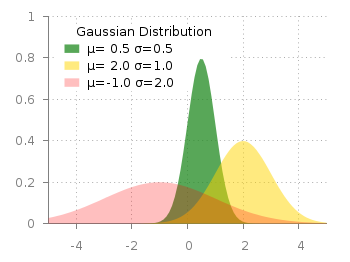
Maybe you all know the nice example of gnuplots transparent fill style. I have replotted it slightly modified in Fig. 1.

Filledcurves with transparency

Fig. 1 Filledcurves with transparency settings as on the gnuplot demo site (code to reproduce this figure)

The interesting part in the code looks like this.

set style fill transparent solid 0.5 noborder
plot d1(x) fs solid 1.0 lc rgb "forest-green" title 'µ= 0.5 σ=0.5', \
     d2(x) lc rgb "gold" title 'µ= 2.0 σ=1.0', \
     d3(x) lc rgb "red" title 'µ=-1.0 σ=2.0'

The set style command sets the fill style to 50% transparency, which is overwritten by the explicit fs option to the first plotting command in order to plot the green curve without transparency.

Filledcurves with different transparency

Fig. 2 Filledcurves with different transparency settings (code to reproduce this figure)

Now the question is how to plot filled curves with different transparency settings? The simple answer is, by just using this explicit fs plot argument. The result is shown in Fig.2 and can be reached with the following code. Now we apply a transparency of 75%, 50%, and 25% going from the green to the red curve.

set style fill noborder
plot d1(x) fs transparent solid 0.75 lc rgb "forest-green" \
        title 'µ= 0.5σ=0.5', \
     d2(x) fs transparent solid 0.50 lc rgb "gold" \
        title 'µ= 2.0 σ=1.0', \
     d3(x) fs transparent solid 0.25 lc rgb "red" \
        title 'µ=-1.0 σ=2.0'