Gnuplotting

Create scientific plots using gnuplot

January 31st, 2014 | 3 Comments

And another plot of the world. This time we are dealing with the raster data from Natural Earth. This data is normally available as tif-files. To use them in gnuplot we have to convert them first, then we can create a plot as shown in Fig. 1.
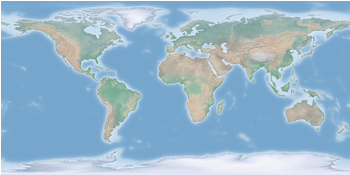
Cross-blended Hypsometric Tints

Fig. 1 Cross-blended hypsometric tint plot of the world. (code to produce this figure, data)

The conversion is done by the convert_natural_earth script. There the tif-file is first scaled down to the desired resolution using imagemagick. Afterwards it is converted to a text file and reordered for the splot command of gnuplot. The text file includes the longitude, latitude and three rgb color values.
You have to invoke the script in the following way.

$ ./convert_natural_earth $RES $FILE

where $RES is the desired resolution in pixel of your gnuplot plot and $FILE the input tif-file.
After finished we can plot the resulting text file simply by

set datafile separator ','
set size ratio -1
plot 'HYP_50M_SR_W_350px.txt' w rgbimage

which results in Fig. 1.
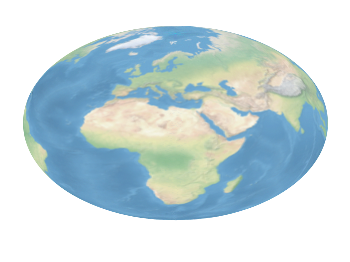
Natural Earth II Shaded Relief and Water

Fig. 2 Natural Earth II shaded relief and water plot of the world. (code to produce this figure, data)

The image can also be projected on a 3D figure of the world as shown in Fig. 2. To achieve this the three rgb values have to be summarized in one value and the rgb variable line color option has to be chosen together with pm3d.

rgb(r,g,b) = 65536 * int(r) + 256 * int(g) + int(b)
set mapping spherical
set angles degrees
splot 'NE2_50M_SR_W_700px.txt' u 1:2:(1):(rgb($3,$4,$5)) w pm3d lc rgb variable
July 29th, 2011 | 5 Comments

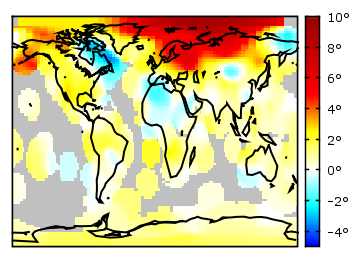
In one post we have used the parametric plot option to plot the world. Here we want to add some temperature data as a heat map to the world plots. The data show the temperature anomalies of the year 2005 in comparison to the baseline 1951-1980 and is part of the GISTEMP data set.

Heat map

Fig. 1 A 2D heat map of the temperature anomalies in 2005 to the baseline 1951-1980 (code to produce this figure, temperature data, world data)

The first problem you face, if you want to create a heat map, is that the data has to be in a specific format shown in the Gnuplot example page for heat maps. Therefore we first arrange the data and end up with this temperature anomalies file. Unknown data points are given by 9999.0.

In order to plot this data to the 2D world map we have to add a reasonable cbrange and a color palette and the plot command for the map:

set cbrange [-5:10]
set palette defined (0 "blue",17 "#00ffff",33 "white",50 "yellow",\
    66 "red",100 "#990000",101 "grey")
plot 'temperature.dat' u 2:1:3 w image, \
     'world.dat' with lines linestyle 1

The trick with the wide range from 0 to 101 for the color bar is chosen in order to use grey for the undefined values (9999.0) without seeing the grey color in the color bar. The result is shown in Fig. 1.

Heat map

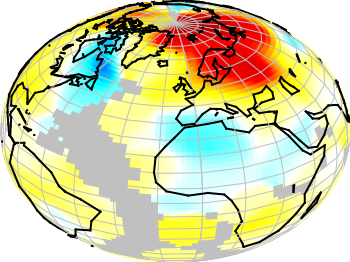
Fig. 2 A 3D heat map of the temperature anomalies in 2005 to the baseline 1951-1980 (code to produce this figure, temperature data, world data)

The same data can easily be applied to the 3D plot of the world. We have to add front to the hidden3d command in order to make the black world lines visible. In addition the radius must be given explicitly as third column to the plot command for the temperature data.

set hidden3d front
splot 'temperature.dat' u 2:1:(1):3 w pm3d, \
      r*cos(v)*cos(u),r*cos(v)*sin(u),r*sin(v) w l ls 2, \
      'world.dat' u 1:2:(1) w l ls 1

The result is shown in Fig. 2.

June 4th, 2010 | 6 Comments

If one have a coordinate system with n-dimension, then one of the dimensions can be expressed by the n-1 other dimensions, e.g. z = f(x,y).
But if you want to plot functions that are defined in polar coordinates, e.g. a sphere, they are complicated to define with z = f(x,y). But Gnuplot offers you a way to handle this type of functions by using its parametric mode. In parametric mode the functions are expressed in angular coordinates t or u,v dependend on the dimensions of your plot.

2D case

In the 2D case we have only one free dimension:

y = f(x)   =>   x = fx(t), y = fy(t)

In Fig. 1 we see the connections between the angular coordinate t and radius r and x,y that is given by

x = r cos(t)
y = r cos(π/2-t) = r sin(t)
Parametric 2D plot

Fig. 1 Connection between Gnuplots parametric variable t and x,y (code to produce this figure)

Using the result from above it is very easy to plot a circle:

set parametric
set trange [0:2*pi]
# Parametric functions for a circle
fx(t) = r*cos(t)
fy(t) = r*sin(t)
plot fx(t),fy(t)
Circle

Fig. 2 Plot of a circle using Gnuplots parametric mode (code to produce this figure)

3D case

In three dimensions we have the case:

z = f(x,y)   =>   x = fx(u,v), y = fy(u,v), z = fz(u,v)

In Fig. 3 we see the connection between the two angular variables u (that is t in the 2D case), v and the radius r:

x = r cos(v) cos(u)
y = r cos(v) sin(u)
z = r sin(u)
Parametric 3D plot

Fig. 3 Connection between Gnuplots parametric variables u,v and x,y,z (code to produce this figure)

Using the parametric variables u,v it is very easy to draw a sphere or a piece of a sphere:

set parametric
set urange [0:3.0/2*pi]
set vrange [-pi/2:pi/2]
# Parametric functions for the sphere
fx(v,u) = r*cos(v)*cos(u)
fy(v,u) = r*cos(v)*sin(u)
fz(v)   = r*sin(v)
splot fx(v,u),fy(v,u),fz(v)

The result is shown in Fig. 4. Note that we have to use 3.0/2, because 3/2 is 1 for Gnuplot!

Sphere

Fig. 4 Plot of a sphere using Gnuplots parametric mode (code to produce this figure)