Gnuplotting

Create scientific plots using gnuplot

March 2nd, 2015 | 4 Comments

If you are a regular gnuplot user you most probably want to reuse some common settings. I normally avoid it on this blog to have easy scripts that run as standalone files, but during my work I use a lot of small config files.
Bessel functions

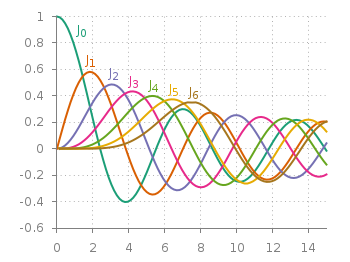
Fig. 1 Bessel functions from order zero up to six plotted with the dark2 line colors. (code to produce this figure, dark2.pal, xyborder.cfg, grid.cfg, mathematics.cfg)

Let us start with the Bessel function example from the last blog entry. As you can see in Fig. 1, it is a 2D plot, including axes, a grid, line colors, and definitions of higher order Bessel functions. All of those could be easily stored in small config files and reused in other plots.
As an example I will start with the axes. Here, I have four different config files, called xyborder.cfg, xborder, yborder.cfg, noborder.cfg, which do exactly what their names would suggest. Here are the first and last file:

# xyborder.cfg
set style line 101 lc rgb '#808080' lt 1 lw 1
set border 3 front ls 101
set tics nomirror out scale 0.75
set format '%g'
# noborder.cfg
set border 0
set style line 101 lc rgb '#808080' lt 1 lw 1
unset xlabel
unset ylabel
set format x ''
set format y ''
set tics scale 0

In the main plotting file I then just have to load the setting I like to have and I’m done. The same can be done for adding a grid, the right line color definitions and the extra Bessel functions leading to the following excerpt from the main plotting file:

# set path of config snippets
set loadpath './config'
# load config snippets
load 'dark2.pal'
load 'xyborder.cfg'
load 'grid.cfg'
load 'mathematics.cfg'

The set loadpath command tells gnuplot the directory where it can find all the configuration snippets. If you want to see an overview, look at my gnuplot configuration snippets and at the collection of palettes and line colors.

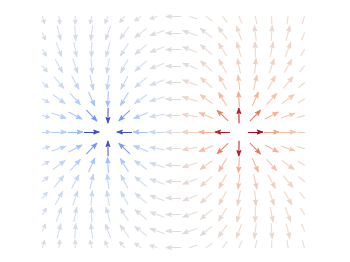
If you want to include more complicated settings, you have to use the macro setting of gnuplot. Fig. 2 is a reproduction of an earlier entry plotting a vector field with arrows. It included an lenghty definition of how to plot these arrows. If you want to do it several time and define the arrows in the same way every time you should also put it into a config file, this time as a variable (macro). In our example it looks like

color_arrows = 'u ($1-dx($1,$2)/2.0):($2-dy($1,$2)/2.0):(dx($1,$2)):(dy($1,$2)):\
(v($1,$2)) with vectors head size 0.08,20,60 filled lc palette'

In the main file the only thing we have then to do is

set macros
load 'noborder.cfg'
load 'moreland.pal'
load 'arrows.cfg'

# [...] 

plot '++' @color_arrows

Important is the first line that enables the use of macros in gnuplot which is disabled by default.
January 22nd, 2012 | No Comments

Axis with arrow

Fig. 1 Plot of a sinusoid with arrows on the axes (code to produce this figure, data)

You can easily add arrows to the end of the x- and y-axis using the set arrow command. The two last values of the size option determines the opening and closing angles of the arrows.

set arrow from graph 1,0 to graph 1.05,0 size screen 0.025,15,60 \
    filled ls 11
set arrow from graph 0,1 to graph 0,1.05 size screen 0.025,15,60 \
    filled ls 11

March 15th, 2011 | No Comments

As you all know Gnuplot is able to add arrows or labels to your plot. But it can even add more complicated objects, by using the object command. You can choose if you want to add a rectangle, ellipse, circle, or polygon. Here we want to add a loudspeaker to our plot, hence we choose the polygon.

loudspeaker

Fig. 1 A loudspeaker drawn with the object command (code to produce this figure)

For a polygon you have to specify the points the polygon should combine. The following points will result in a shape of the desired loudspeaker.

a = 1.0/3
set object 1 polygon from \
    -1, 1 to \
     0, 1 to \
     0, a to \
     1, 1 to \
     1,-1 to \
     0,-a to \
     0,-1 to \
    -1,-1 to \
    -1, 1

After this we do some fine tuning on the appearance of the object and remove all borders and tics from the plot.

unset border
unset tics
set object 1 fc rgb '#000000' fillstyle solid lw 0

In order to draw the loudspeaker we need a plot command. For this we use the parametric mode to draw parts of circles with different radii. Here I will only present the used functions, for an explanation of the parametric mode have a look at the Understand parametric mode entry.

set trange [-pi/6:pi/6]
fx(t,r) = r*cos(t)
fy(t,r) = r*sin(t)

September 23rd, 2010 | 5 Comments

In the last entry we had mean and standard variation data for five different conditions. Now let us assume that we have only two different conditions, but have measured with three different instruments A, B and C. We have used a ANOVA to verify that the data for the two conditions are significant different. As a result the plot in Fig. 1 should be created.

statistics

Fig. 1 Plot the mean and variance of the given data (code to produce this figure)

Therefore we store our data in a format, that can be used by the index command in Gnuplot. Note that the data have two empty lines between the blocks in the real data file:

# mean      std
# A
0.77671    0.20751
0.33354    0.30969
 
 
# B
0.64258    0.22984
0.19621    0.22597
 
 
# C
0.49500    0.31147
0.14567    0.21857

Now every instrument is stored in a different data block containing both conditions as columns.

The color definitions and axes settings are done in a similar way as in the previous blog entry. Note that we have to define two more colors for the boxes, because we use three different colors. Also we define a black line to plot the significance indicator (arrow).

set style line 1 lc rgb 'gray30' lt 1 lw 2
set style line 2 lc rgb 'gray40' lt 1 lw 2
set style line 3 lc rgb 'gray70' lt 1 lw 2
set style line 4 lc rgb 'gray90' lt 1 lw 2
set style line 5 lc rgb 'black' lt 1 lw 1.5
set style fill solid 1.0 border rgb 'grey30'

The significance indicator is created by three black arrows and a text label:

# Draw line for significance test
set arrow 1 from 0,1 to 1,1 nohead ls 5
set arrow 2 from 0,1 to 0,0.95 nohead ls 5
set arrow 3 from 1,1 to 1,0.95 nohead ls 5
set label '**' at 0.5,1.05 center

For the plot the index command is used to plot first condition A, then B and then C by using block 0,1, and 2 respectively. The x-position of the boxes for instrument A are slightly shifted to the left, the ones for C to the right by subtracting or adding the value of bs. The value of bs has the width of one box in order to plot the boxes side by side.

# Size of one box
bs = 0.2
# Plot mean with variance (std^2) as boxes with yerrorbar
plot 'statistics.dat' i 0 u ($0-bs):1:($2**2) notitle w yerrorb ls 1, \
     ''               i 0 u ($0-bs):1:(bs) t 'A' w boxes ls 2, \
     ''               i 1 u 0:1:($2**2) notitle w yerrorb ls 1, \
     ''               i 1 u 0:1:(bs) t 'B' w boxes ls 3, \
     ''               i 2 u ($0+bs):1:($2**2) notitle w yerrorb ls 1, \
     ''               i 2 u ($0+bs):1:(bs) t 'C' w boxes ls 4

September 9th, 2010 | No Comments

If we have done a experiment in order to apply a significance test like a ANOVA to our measured data, we are interested in presenting our statistical data in a familiar way.
Let us assume we have the following mean and standard deviation data for five different conditions:

"A"     0.66257     0.41854
"B"     0.70842     0.38418
"C"     0.66733     0.44059
"D"     0.45375     0.52384
"E"     0.43900     0.53116

The results for the last two conditions are significant different from the first ones. Using this data we want to create a plot that looks like the one in Fig. 1.

mean and variance

Fig. 1 Plot the mean and variance of the given data (code to produce this figure)

To achieve the plot in Fig. 1 we have to define two different color styles for the color of the errorbars and the color of the boxes. Also, we need the fill style (solid) for the boxes and the gray line around the boxes which is given by the border rgb 'grey30' option to the set style fill command. For the line color we choose the same color as for the errorbars:

set style line 1 lc rgb 'grey30' ps 0 lt 1 lw 2
set style line 2 lc rgb 'grey70' lt 1 lw 2
set style fill solid 1.0 border rgb 'grey30'

For the first line style which is used to plot the errorbars also a point size of 0 is specified in order to plot only the errorbars and no points on top of the boxes.

The *-dots above the two last conditions to indicate their significant difference are just added as labels. The border of the graph on the top and right side is removed by set border 3 (see here for an explanation of the number codes) and by using the nomirror option for the tics. The xtics are not visible, because we set them to scale 0.

set label '*' at 3,0.8 center
set label '*' at 4,0.8 center
set border 3
set xtics nomirror scale 0
set ytics nomirror out scale 0.75 0.5

Then we plot first the errorbars in order to overlay the boxes on it, so only the top half of the errorbars will be visible. Note that we have standard deviation data in the data file, therefore we have to use their squares in order to get the variance. As xtic labels we use the first row in the data file by appending xtic(1):

plot 'simple_statistics.dat' u 0:2:($3**2) w yerrorbars ls 1, \
     ''                      u 0:2:(0.7):xtic(1) w boxes ls 2