Gnuplotting

Create scientific plots using gnuplot

November 7th, 2012 | 6 Comments

Assume you have a data file describing a trajectory that you would like to animate like the spiral shown in Fig. 1.

moving spiral

Fig. 1 An animated spiral trajectory (code to produce this figure, data)

In order to create the animation we have to produce a set of png images and create the resulting gif animation with GIMP as shown in the Animation I – gif entry. Therefor, we have to tell gnuplot at which point of the data it has to stop for each image. This can be achieved by the every option. The point at the end of the line is just one data point. Here the start point and end point for every are just the same.

do for [ii=1:99] {
    splot 'spiral.txt' every ::1::ii w l ls 1, \
          'spiral.txt' every ::ii::ii w p ls 1
}

The downward spiral is created by running the loop in the other direction.

do for [ii=99:1:-1] {
    splot 'spiral.txt' every ::1::ii w l ls 1, \
          'spiral.txt' every ::ii::ii w p ls 1
}

By the way, I don’t know why the antialiasing of the output png images is not working in this example. If you have any idea, feel free to tell me.Assume you have a data file describing a trajectory that you would like to animate like the spiral shown in Fig. 1.
October 21st, 2011 | 11 Comments

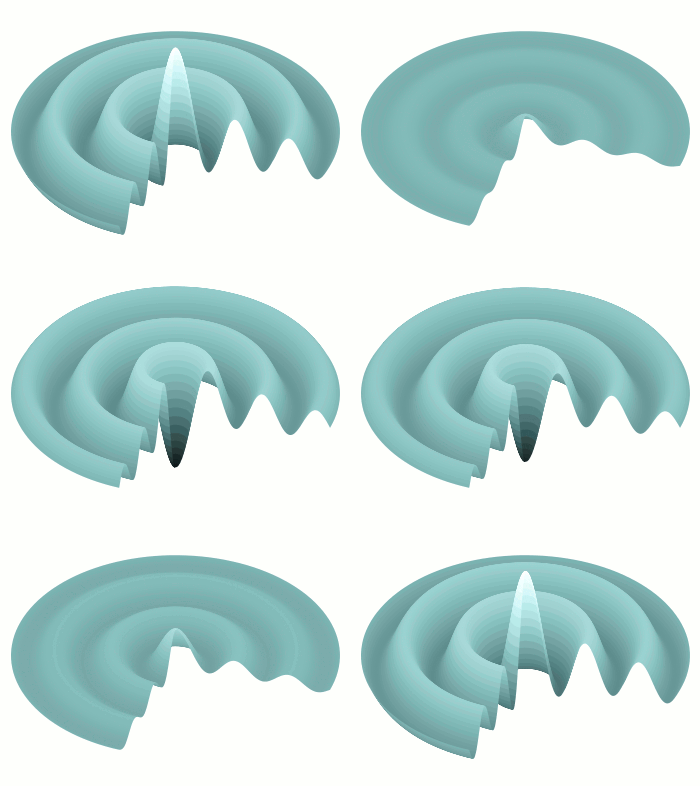
For presentation or teaching purposes it can be useful to show not only a figure, but an animation to illustrate something more clear. There exists different possibilities to do this in Gnuplot. Today we will have a look at how to create a gif animation.

Bessel function

Fig. 1 Animation of Bessel function (code to produce this figure, loop)

Fig. 1 shows a gif animation of a Bessel function of first kind and zeroth order. Gnuplot has a gif output terminal, but the result will be smoother if we first create png files with Gnuplot and then the animated gif file with another program. In order to create a set of png files we have to loop through the time value t and different output files.

# initializing values for the loop and start the loop
t = 0
end_time = 1
system('mkdir -p animation')
load 'bessel.plt'

The above code sets a start value for the running time variable t and the end_time variable at which the looping should be stopped. Then a folder for the output png files is created and the loop file bessel.plt is loaded. The content of this loop file is shown below.

# bessel loop
t = t + 0.02
outfile = sprintf('animation/bessel%03.0f.png',50*t)
set output outfile
splot u*sin(v),u*cos(v),bessel(u,t) w pm3d ls 1
if(t<end_time) reread;

Here we update the time t, create a file name with a different number and plot out Bessel function. Finally the last line checks if our time t is smaller than the end_time variable, and executes the loop again if this is the case.

After we have created the png files in the animation folder, we start GIMP and load all the files as layers (File > Open as Layers). After this we save all layers together as an animated gif file.