April 27th, 2010 | 55 Comments
Gnuplot gives us the opportunity to produce great looking plots in a lot of different formats. Therefore it uses different output terminals that can produce output files or as in the last chapter display the output on your computer screen. In this tutorial we will cover the png, svg, postscript and epslatex terminals. Therefore we will use the same code as in the previous plot functions chapter. We already used the wxt terminal there which displays the result on the screen:
set terminal wxt size 350,262 enhanced font 'Verdana,10' persist
png, and svg terminal
The png and svg terminals produce more or less the same looking output as the wxt terminal, so you only have to replace the line for the wxt terminal with
set terminal pngcairo size 350,262 enhanced font 'Verdana,10'
set output 'introduction.png'
for png and with
set terminal svg size 350,262 fname 'Verdana' fsize 10
set output 'introduction.svg'
for svg to produce the same figures I have posted in the last chapter. You may have noticed that we use the pngcairo terminal. It exists also a png terminal, but it produces uglier output and doesn’t use the UTF-8 encoding the cairo library does. You may also have noticed that we set the size to a given x,y value. If we don’t do this, the default value of 640,480 is used. The enhanced option tells the terminals that they should interpret something like n_1 for us. But be aware that not all terminals handle the enhanced notation as mentioned in the gnuplot documentation.
Since we want to create an output file in both cases we have to specify one.
The png and svg terminals work very well to produce figures to use on the web as you can see on this page, but for scientific papers or other stuff written in LaTeX we would like to have figures in postscript or pdf format. I always create my pdf files of the plots from the postscript files, so I will cover only the postscript terminals in this introduction.
postscript terminal
gnuplot has a postscript terminal that can be used to produce figures in the eps format:
set terminal postscript eps enhanced color font 'Helvetica,10'
set output 'introduction.eps'
But this creates very tiny fonts, as stated in the documentation:
In eps mode the whole plot, including the fonts, is reduced to half of the default size.
So if we want to produce the same font and line width dimensions, we have to use this command:
set terminal postscript eps size 3.5,2.62 enhanced color \
    font 'Helvetica,20' linewidth 2
It tells the terminal the size in inches of the plot (note that this is the pixel dimension divided by 100) and uses a font size of 20 instead of 10. In addition to that it doubles the given line widths by a factor of 2.
Besides, the postscript terminal can’t handle all UTF-8 input characters and we have to use the enhanced mode to produce greek letter etc. But in opposite to the before mentioned terminals the enhanced mode will work fully for the postscript terminal.
set xlabel '{/Helvetica-Oblique x}'
set ylabel '{/Helvetica-Oblique y}'
set xtics ('-2{/Symbol p}' -2*pi,'-{/Symbol p}' -pi,0, \
    '{/Symbol p}' pi,'2{/Symbol p}' 2*pi)
plot f(x) title 'sin({/Helvetica-Oblique x})' with lines linestyle 1, \
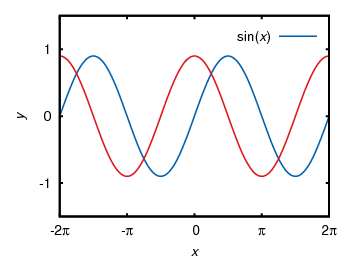
Finally, we will get the following figure. Note, that I have converted the resulting eps file to png with Gimp using strong text and graphics antialiasing to show it here. But the overall looking should be the same as with the original eps file.

Fig. 1 Sinusoid plotted using the postscript terminal (code to produce this figure)
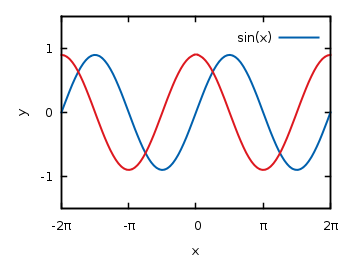
If we compare Fig. 1 to the original png file made with the pngcairo terminal (Fig. 2) we see that we still have some changes. We need to adjust the tic scales and line widths by hand to get exactly the same result. Note: the font is of course different, because we used another one.

Fig. 2 Sinusoid plotted using the pngcairo terminal (code to produce this figure)
This means we should consider if want to create svg and png images or if we want to create eps and png images. In the first case we will use the wxt, svg and pngcairo terminals together.
In the second case we will use only the postscript terminal and create the png files using Gimp or some other image processor.
You may think the handling of symbols e.g. greek letters is very weird in the postscript terminal and you are probably right. But you can also write symbols in LaTeX notation, therefore you have to use the epslatex terminal.
epslatex terminal
If you have to write formulas or a scientific paper you are mostly interested in postscript/pdf or LaTeX output. The best way is to use both of them. That means to producing the lines etc. in the figure as a postscript image, but generate also a tex file that adds the text for us. The postscript image can be easily converted to a pdf using epstopdf if you needed a pdf version of the image. In order to create the tex file containing our figure labels we will use the epslatex terminal. Basically it has two working modes, a standalone mode that can produce a standalone postscript figure and the normal mode that produces a postscript figure and a tex file to include in your LaTeX document. I think the normal mode is the more common application so I will start with this.
For the normal mode we use the following terminal definition:
set terminal epslatex size 3.5,2.62 color colortext
set output 'introduction.tex'
color and colortext are needed if you have some colored labels, text etc. in your plot. size specifies the size of your plot in inches. You can specify the size alternatively in cm:
set terminal epslatex size 8.89cm,6.65cm color colortext
The easiest way is to specify the size to a value that corresponds with the needed one in your latex document. One way to get these values is to set your view to 100% in your pdf-viewer and measure the size of the area which should contain your figure. In Linux this is easily done using ScreenRuler.
Now we can write the labels etc. in LaTeX notation:
set xlabel '$x$'
set ylabel '$y$'
set format '$%g$'
set xtics ('$-2\pi$' -2*pi,'$-\pi$' -pi,0,'$\pi$' pi,'$2\pi$' 2*pi)
plot f(x) title '$\sin(x)$' with lines linestyle 1, \
Note that it is necessary to use the '' quotes and not "" in order to have interpreted your LaTeX code correctly.
If we run gnuplot on this file, it will generate a introduction.tex and a introduction-inc.eps file. In the LaTeX document we can then include the figure by:
\begin{figure}
    \input{introduction}
\end{figure}
Now our figure uses automatically the font and font size of our paper, but we still have to check that the line widths and tics have the size we want to. Also the size of the figure itself has to be correct in order to include it with the \input command without resizing it. Therefore we had to know the size of our figure before hand as mentioned above. Otherwise you should use the \resizebox command in LaTeX, but then it could be that your font size will be incorrect.
\begin{figure}
    \resizebox{\columnwidth}{!}{\input{introduction}}
\end{figure}
Note that you need the color package for colored labels. Therefore put \usepackage{color} in the preamble.
If you haven’t any LaTeX document, but want only to produce a figure with LaTeX labels, you can use the standalone mode.
Therefore exchange the above code with
set terminal epslatex size 3.5,2.62 standalone color colortext 10
set output 'introduction.tex'
The last value is the font size of the plot, which you don’t need if you want to include the figure in your LaTeX document.
To produce the standalone figure we have to run more than just the gnuplot command:
$ gnuplot introduction.gnu
$ latex introduction.tex
$ dvips -o introduction.ps introduction.dvi
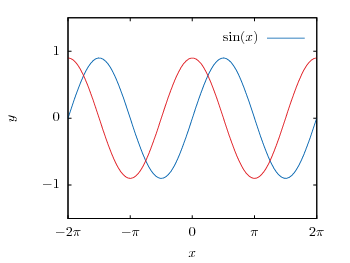
The first command results in two files: introduction.tex with a LaTeX header and introduction-inc.eps which is the eps file of the figure without any text. The latex command combine the two to a single dvi file and dvips generates a postscript file. Finally I have converted the postscript file with Gimp and we will get this png file:

Fig. 3 Sinusoid plotted using the epslatex terminal (code to produce this figure)
If we compare this to Fig. 2 it is obvious that we have to fine tune the line widths and tics to get the same result as for the pngcairo terminal. In order to correct it we take the following values:
set border linewidth 2
set style line 1 linecolor rgb '#0060ad' linetype 1 linewidth 5
set style line 2 linecolor rgb '#dd181f' linetype 1 linewidth 5
set tics scale 1.25
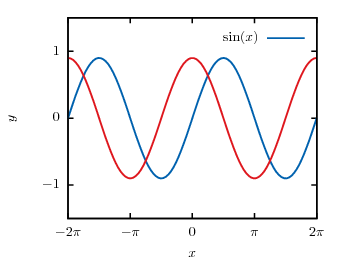
Applying these settings will finally yield to a figure which looks like it should:

Fig. 4 Sinusoid plotted using the epslatex terminal with corrected line width and tics (code to produce this figure)
Thanks for this, the epslatex part was very helpful!
[…] is a little update to the epslatex terminal introduction […]
Many thanks indeed; epslatex is extremely important
This is a very good article. I never knew of the epslatex terminal before this. Really good work, and keep it up!
Many thanks!
Hi all,
any idea how I could include 2 figures side-by-side. I’ve tried with \subfigure cmd, but it doesnt seem work. I got two error messages.
The other option in LaTeX to place figures side-by-side is to use minpage. Do something like this:
\begin{figure}
\begin{minipage}[t]{6cm}
\input{your_file1}
\caption{your caption1}
\end{minipage}
\hfill
\begin{minipage}[t]{6cm}
\input{your_file2}
\caption{your caption2}
\end{minipage}
\end{figure}
Excellent article. I was bashing my head for whole day to fix the font sizes in no of ways and this page helped all. Keep it up.
Can we change the color of title? Here if I try to change the color of ‘SIn(x)’ in the graph, what should I do?
Nice article! I use the standalone version as standard procedure to produce my plots. However, I’m interestet in using BibTeX in gnuplot. Is that possible? For example, I want to plot a comparison between some theory and experimental data from literature. So, I want a reference (using BibTeX) in the key.
@najmul: you can set the color of the legend by
@Lars: if you using the epslatex to produce the plot, then all the text in the graph is created by LaTeX and you can include BibTeX entries, for example:
plot 'data.txt' title '\cite{datasource2012}'hi
I have many function in gnuplot I needed to get the output file as a data do you know how ?
You can use the table command, which is for example used in the electron and positron entry.
Thank you very much for your answer, but I have another question, if possible.
Hi all
I try to draw the data by point and the direction of this point by vector
But I got Different lengths of vectors I dont know why ? Is it possible to change the length of the vector ? How ?
Thanks. Output looks very nice! I think scientist should seriously consider using Gnuplot. Today they are usign too much commercial tools such as MatLab. Some uses open source solutions but favours Python + Matplotlib. I don’t say that this second choice is bad, but Python is too bulky a language and its syntax is rather suited for computer scientists rather than physical science people. Then why not use Gnuplot? Maybe its syntax is hard to remember ?!
Hello.
I want to plot a file ‘light_curve.txt’ with yerr. the comand i used is
plot ‘light_curve.txt’ u 1:3:4 w yerr
But after this I can’t see any plot window. Can you please help me? I am using ubuntu OS and my Gnuplot version is 4.4. Do I have to do any terminal setting for plotting the text file?
Try to set a terminal first.
Great article!
Question: With GNUplot 4.6.1 on OSX 10.6.8:
I’m using a symbol font called Moon Phases, and have it in .ttf, .otf and Postscript. The output in Aqua displays just fine; e.g.:
“u (myDateSP(1,2)):3:((strcol(4) eq “Last”) ? (“A”):1/0) w labels left font “Moon Phases,28″ offset” (“A” translates to the Full Moon symbol.
But I cannot for the life of me persuade pdfcairo, postscript or epscairo to access that font. Fontpath in GN shows the proper paths to the font; I have tried using fontpath explicitly to point to the font files in the GN working directory; can’t seem to get it to work.
The other font in the plot is Gill Sans, and that seems to work fine in the other terminals as well as Aqua.
Any advice about how to add that symbol font so PDF can use it?
Hi,
Great tutorial!
I have a question: I tried to plot using epslatex standalone term as you suggested. Then I wrote this formula in the key $log(M_{g}/M_{\odot}) = (0.8660 \pm 0.0233)log(M_{g}/M_{\odot}) + (1.3564 \pm 0.2633)$, but is to big!!. Is there a way to change the font size?
Any advice here?
You could try to change the font size by including a
\smallor\footnotesizein your LaTeX code.I have troubles with eps.
If I use this line:
set terminal postscript portrait size 3.5,2.62 solid enhanced color
I get a nice color postscript file. However if I ask for eps giving the command:
set terminal postscript portrait eps size 3.5,2.62 solid enhanced color
I get a black-and-white ps file.
Any idea why this happens?
Thanks. A great post.
A suggestion, please add some details on multiple plots. I searched really bad for hours for plotting multiple plots in eps file, until I stumbled upon the command ‘set multiplot’.
It is surprising how the code works for everything else except eps without this command.
Thanks,
Sujoy.
Awesome tutorial. Thanks!
Many thanks for the tutorial, really helpful !
Hi,
very nice tutorial. I have a question: how can I use the same fonts as for the pngcairo terminal font when using epslatex?
thanks
Hi Anna.
There is now easy way of using exactly the same fonts, because you are depending on the fonts available with your LaTeX installation.
For producing epslatex plots with Helvetica I’m using the following terminal setting:
set terminal epslatex size 8.9cm,3.5cm color colortext standalone \ font "helvet,8" header '\renewcommand{\familydefault}{\sfdefault}\ \usepackage{sansmath}\ \usepackage{helvet}\ \sansmath'Thanks a lot for the answer and for sharing your knowledge of Gnuplot!
People often plot png and epslatex output. If you use latex commands in your plot’s title, labels etc. the png output can get pretty ugly, printing all the LaTeX commands. I’d love to see an easy way to get gnuplot to strip label texts etc. of LaTeX commands prior to plotting with a terminal other than the *tex ones. Do you have a solution?
It is also possible to have standalone latex output produced by the script file. Something like this:
#!/usr/bin/gnuplot # This is obviously intended for Linux set terminal epslatex color lw 3 standalone colortext font 8\ header '\usepackage{grffile}' infile = 'somedata.txt' # Also used for filename generation so set it set title 'Some Stanalone \LaTeX' set format x '$%.0P\pi$' # Note the LaTeX set xrange [-3*pi:3*pi] set output infile.'.tex' plot sin(x) set output # Need to close the output file before latex can work with it system 'pdflatex -shell-escape -interaction=batchmode '.infile.\ '.tex > /dev/null; rm '.infile.'-inc.eps '.infile.\ '-inc-eps-converted-to.pdf '.infile.'.tex $(basename '.\ infile.').log $(basename '.infile.').aux; mv $(basename '.infile.\ '.pdf) $(dirname '.infile.'.pdf); gnome-open '.infile.'.pdf'[…] Source: http://www.gnuplotting.org/output-terminals/ […]
when I try to run latex, I get the error file ‘my_file-inc’ not found. There is in the same directory the file ‘my_file-inc.eps’, and when I change the line in the .tex file to ‘my_file-inc.eps’ it compiles, but I can’t get it to work without having to manually edit every .tex file.
Does anyone know how to fix this?
Thanks.
Without an example and details about your LaTeX installation, I can’t be sure, what the underlying problem is. But If just changing a line in files fixes it, you could do something like this:
`sed 's/\(includegraphics\){\(.*-inc\)}/\1{\2.eps}/g' *.tex`But be carefull because that replaces all occurences of the searchstring in all .tex documents and you don’t want to do that lightly.
What exact details/examples do you need?
I think that solution might work in my case, but it would be good to be able to fix the problem, not put a bandaid on it.
Hello,
Great article so far. It helps me a lot.
I had a problem to compile the .tex file. After searching a while I found out that it is necessary to close the output file with set outpu or set o at the end of the .gp file.
There was a fault like that, when I tried without set o:
! Missing } inserted. } l.9 \end{figure}Thanks for your wonderful site on gnuplot!
A comment on font size in the postscript terminal. Instead of changing the font size inside your script, as you do, I think it is better to use the terminal fontscale magnification factor. For example:
set term postscript eps font ‘Helvetica’ fontscale 2
will produce fonts that are the size of what you see on the screen (because multiplying font size by 2 compensates for the default half-size). This is especially useful if you use different font sizes (e.g., 10 and 11) for different plot elements (e.g., tic labels and axes) because all will be multiplicated by the same size factor.
@David:
Sorry for the late answer. A minimal example plot that reproduces the problem and the version of latex you are using and the OS you’re using it on.
Thanks for the wonderful post, and thanks Cristoph for the script to automatically remove the intermediate files.
Just a heads up: I had to ensure that epstopdf was installed to get pdflatex working with standalone eps files, other wise you get the following error:
“Error: File `output-inc-eps-converted-to.pdf’ not found.”
On Linux Mint:
“$ epstopdf
The program ‘epstopdf’ is currently not installed. You can install it by typing:
sudo apt-get install texlive-font-utils”
Hello,
is there a way to reduce the length of the lines in the key? It appears to me that this terminal produces way longer lines then other terminals and sometimes the explanation overlap with the plot.
Here is an example of a produced eps file
http://www.imagebam.com/image/455581422477553
Hi Lennart.
In gerneral I would propose to not use the legend key, but put the labels directly to the lines. This is a lot nicer, for example Fig. 1 from Rotate label automatically by fiting the data:
Fig. 1 Photon flux density for different characteristic tail state energies E0 dependent on the photon energy. (code to produce this figure, data)
Otherwise the length of the line should be controllable via
samplen, see http://www.gnuplotting.org/manpage-gnuplot-4-6/#Q1-1-462Hi Hagen,
thanks a lot for your reply. It works fine!
Okay I have a really big problem, I have some plots for my bachelor thesis where I need to use the greek letters for Delta und Omega. I let gnuplot produce an .eps to integrate in an LaTex file.
set terminal postscript eps enhanced color solid
set output ‘V50_DD_vh.eps’
set xlabel “Widerstand R [{/Symbol W}]”
set ylabel “Differenzdruck {/Symbol D}p_{w} [mbar]”
There are no probles with the p_w or other symbols like alpha but with Delta and Omega it always creats weird symbols. I tried to find the source of the problem but every symbol except these two looks right. Anyone of you has the same problem as me or knows how to solve it?
Hi, I have a problem
I need an eps graphic only with all latex label include. I’m using standalone mode for that, but I’m not understand how to produce the final eps
“To produce the standalone figure we have to run more than just the gnuplot command:
$ gnuplot introduction.gnu
$ latex introduction.tex
$ dvips -o introduction.ps introduction.dvi”
Where do I type the command above?? Gnuplot or other software??
As I work normally under Linux, the commands are executed inside the Bash.
Very nice script, but I can not reproduce the solar mass symbol \odot with this script. Could you please suggest how to make it?
Thank you!
[…] Output terminals « Gnuplotting […]
I used to use gnuplot to print on a postscript enbabled hp2500 color laser printer.
Now I am stuck with non postscript printers such as the office jet HP 8600.
What is the solution for this
Homer W Smith
CEO LIghtlink Internet
[…] http://www.gnuplotting.org/output-terminals/ […]
I am new to gnuplot
Mac OS Sierra v10.12.3
Have successfully installed via homebrew the following applications:
CLT
Xcode 8.2
Xquartz v2.7.11dmg needed to install gnuplot (x11 requirement unsatisfied)
setting term to any one terminal types, results in garbbage output on screen or no output at all from gnuplot> plot sin(x)
Can any one help?
And what about epscairo, latexcairo, latex, tikz and another different terminals? Any advantages/disadvantages of using them?
Thank you very much